hi,
by scrolling the CodeEditorComponent the memory amount increase in the Taskmanager and dont drop.
Observed in WIN10 on Introjucer and Jucedemo.
hi,
by scrolling the CodeEditorComponent the memory amount increase in the Taskmanager and dont drop.
Observed in WIN10 on Introjucer and Jucedemo.
Endlessly?
most likely
No, it's actually very unlikely.
If there's no leak (and I'm pretty sure there isn't because all the classes involved have leak detectors) then an increase in memory is probably just heap fragmentation or the OS using memory for graphics updates etc.
If you see an actual leak, then please let me know, but honestly: task manager is almost completely useless, and often downright misleading as a debugging tool.
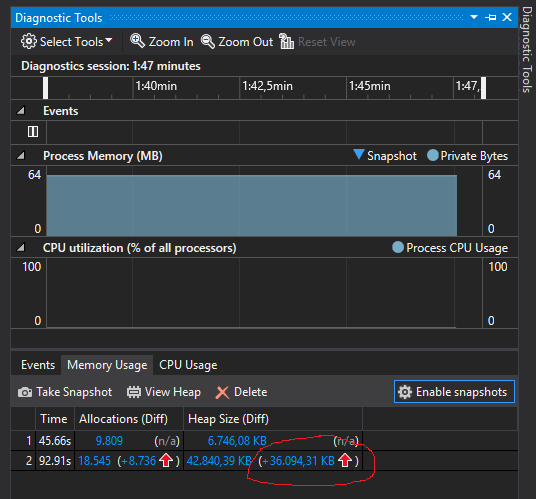
I scrolled the CodeEditorComponent 3min permanently up and down, the Application reaches 5gb memory usage and crashed. IMHO no normal OS graphics caching beachavior.
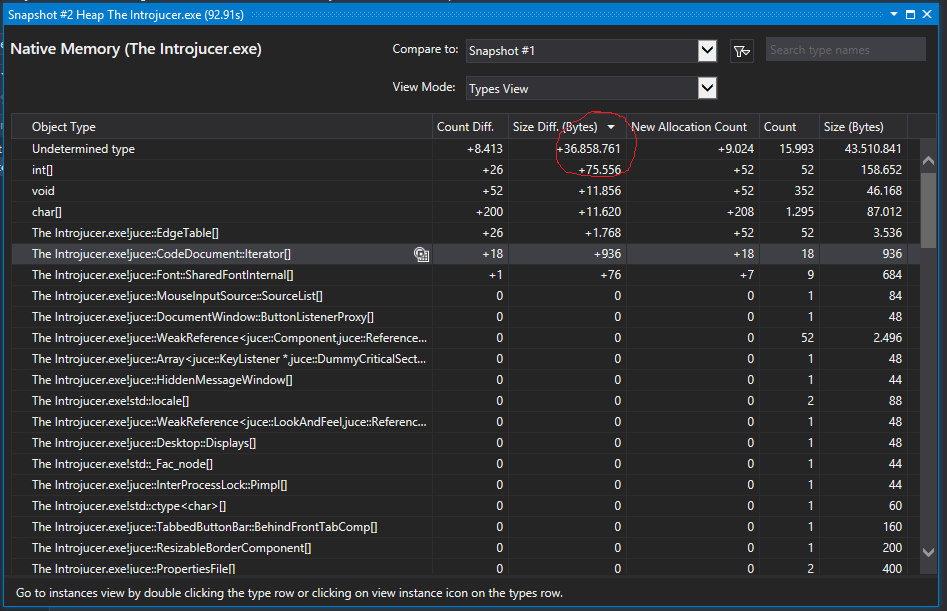
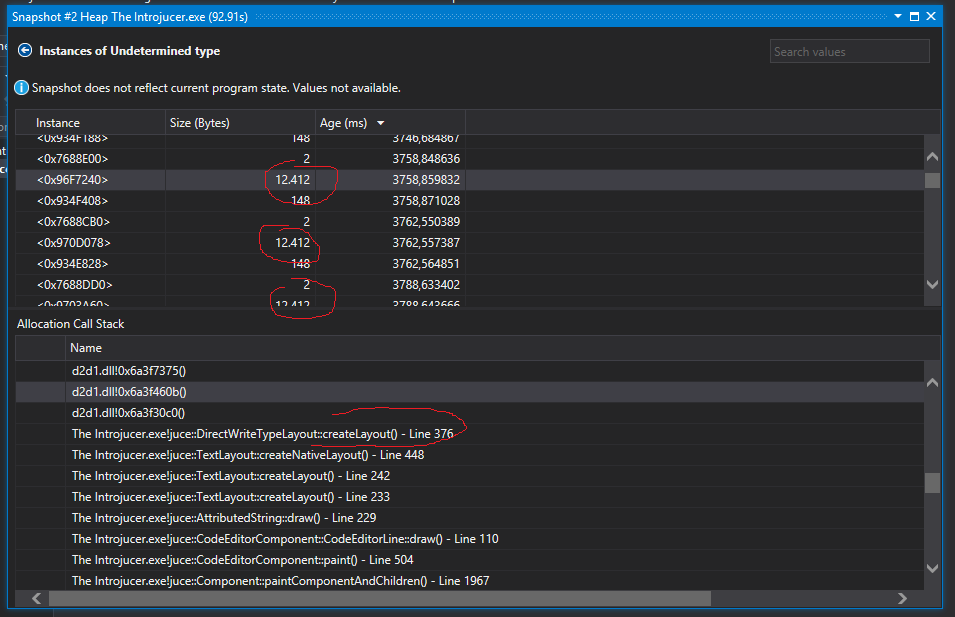
After debugging i found that the AttributedString::draw function creates everytime a new TextLayout. On Windows its creates every time a DirectWriteTypeLayout that are accumulated an rises the memory up. The older aren't deleted.
I disabled DirectWrite and it helps. There is no increasing in memory.
Sorry, but I can't reproduce this.
I tried running the introjucer, and scrolling up and down. No increase at all in memory in track manager. No reports of leaks on shutdown, from either the MS leak checker or the juce one.
The fact that it's DirectWrite-related is interesting, but a quick sanity-check of that code doesn't show any problems with ref-counting - all objects appear to be correctly handled.
Not sure what to suggest - I can't fix something without being able to see it happen!
no, there is no leak in JUCE.
i have attached screenshoots from debugging.
when scrolling the CodeEditorComponent 40s the heap grows 36mb and growes endless
it creates everytime when scrolling for every AttributedString 12kb objects that are never freed, on every scroll !!! and are accumulated until the Application crashes.
the problem is maybe on CreateDCRenderTarget in CustomDirectWriteTextRenderer
Its on WIN10 compiled with VS2015 and DirectWrite enabled. Without DirectWrite it runs without problems.
Can this thread moved in the Windows specific forum, because its a Windows only issue?
 void createLayout (TextLayout& layout, const AttributedString& text, IDWriteFactory* const directWriteFactory,
                       ID2D1Factory* const direct2dFactory, IDWriteFontCollection* const fontCollection)
    {
        // To add color to text, we need to create a D2D render target
        // Since we are not actually rendering to a D2D context we create a temporary GDI render target
        D2D1_RENDER_TARGET_PROPERTIES d2dRTProp = D2D1::RenderTargetProperties (D2D1_RENDER_TARGET_TYPE_SOFTWARE,
                                                                                D2D1::PixelFormat (DXGI_FORMAT_B8G8R8A8_UNORM,
                                                                                                   D2D1_ALPHA_MODE_IGNORE),
                                                                                0, 0,
                                                                                D2D1_RENDER_TARGET_USAGE_GDI_COMPATIBLE,
                                                                                D2D1_FEATURE_LEVEL_DEFAULT);
        ComSmartPtr<ID2D1DCRenderTarget> renderTarget;
        HRESULT hr = direct2dFactory->CreateDCRenderTarget (&d2dRTProp, renderTarget.resetAndGetPointerAddress());
        ComSmartPtr<IDWriteTextLayout> dwTextLayout;
        if (! setupLayout (text, layout.getWidth(), layout.getHeight(), renderTarget,
                           directWriteFactory, fontCollection, dwTextLayout))
            return;
        UINT32 actualLineCount = 0;
        hr = dwTextLayout->GetLineMetrics (nullptr, 0, &actualLineCount);
I'm not doubting that you're seeing something, but without being able to reproduce it, I'm not sure what we can do!
Why do you suggest it might be the CreateDCRenderTarget call? The ref-counting for that looks perfectly OK to me, doesn't seem possible for it to be leaked..
It seems, its a bug in Windows10. I can't reproduce it in Windows7 running in a VM.
Yes, same here. Nasty.. We'll try to do some digging on Windows 10 and see if we can narrow it down.
FYI this did seem to be something that got broken in Windows 10, but we've pushed a workaround that seems to sort it out now - let us know if you still have any problems!