Quick coffee break test as I have to return to the day job… but here’s a couple of screenshots of my own profiler with a launch of the standalone build of my plugin:
Juce 6.07 - editorCreate time is 260ms, with 33ms for instantiation of my editor instance within it.
Juce 6.1.1 - editorCreate time is 1second, 368ms, with 33ms for instantiation of my editor instance within it (ie. same time to instantiate the actual GUI elements)
When running as a VST3 plugin, editor open times are faster in general since the audio processor gets instantiated ahead of time (and any task associated with that are completed already) - especially on 2nd and consequent editor opens (since processor doesn’t get instantiated each time).
(The second line/thread of ticks in the profile view is the audio callback)
6.0.7:

6.1.1:
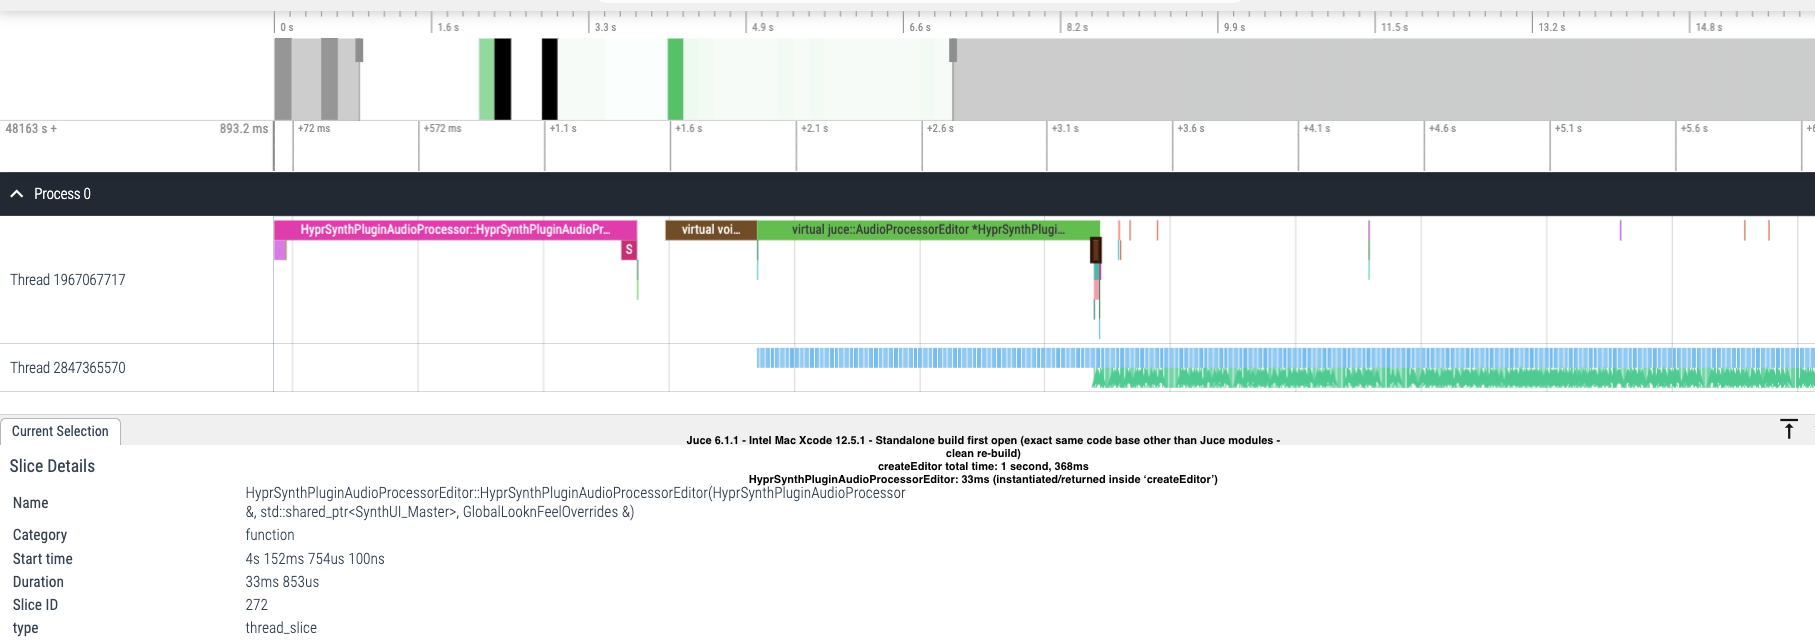
6.1.1:

FYI… the green lines that appear under the audio thread ticks are my UI oscilloscope function… which only gets called with buffer data once the UI is loaded of course.
(edit: there is nothing conclusive about these traces of course, since I don’t see every thread/process
here - I will need to do a deeper/full trace using the Xcode/VS profilers)