dsp::LookupTableTransform speed issue

So I’ve been looking to replace some operations with lookup tables to optimize cpu usage. So naturally dsp::LookupTableTransform seems a good choice for this, except it appears to not be fast in my case? I’m currently using it to replace a non integer power of 2 operation that’s called every sample, and an exponential function also called every sample.

For instance, I have the operation:
fmin(exp(2.99573227355 + 0.01 * value * 6.90775527898), (m_sampleRate / 2.0) - 500.0)
(this simply transforms a “value” of 0 to 100 to a frequency within a certain range)

I’ve since tried replacing it with a lookup table initialized like:
freqScale.initialise([=](float value) {return fmin(exp(2.99573227355 + 0.01 * value * 6.90775527898), (m_sampleRate / 2.0) - 500.0); }, 0.0, 100.0, 1000);
and called like:
processor.freqScale[value];

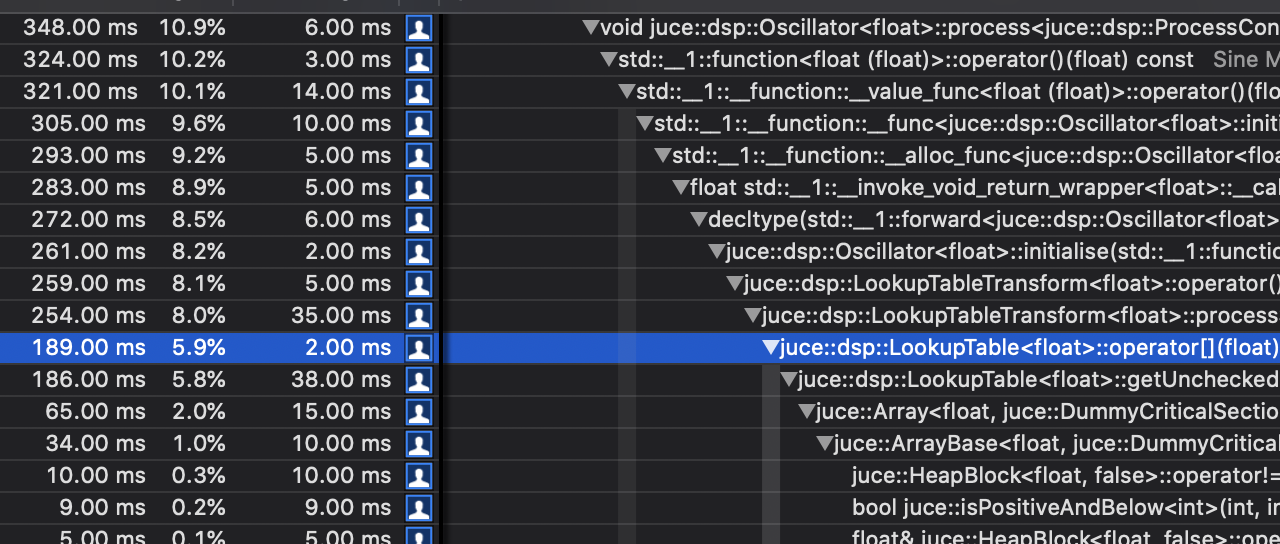
But after cpu profiling in debug mode (in vs 2015), it appears to use significantly more cpu than using the function directly - but of course I would suppose that was simply because I was running in debug mode.

I can’t look at the function directly when profiling in release mode, but eyeballing the cpu usage in Ableton with the plugin’s release, it seemed like it at least made no difference in cpu usage if not slightly increased it. Although again this may not be fully reliable as I know my cpu dynamically changes its clock speed depending on load.

So is there something wrong here? Or are operations like pow and exp just too simple to replace with a lookup table?

Cheers!

You can’t measure debug builds so forget about that. The release version will have completely different performance characteristics. Why can’t you profile the release version?

Eye-balling CPU usage in Ableton is also not worth much. If it really matters, then write a program to measure both ways and see how it is.

3 Likes

I have managed to profile the release version actually, by forcing generation of debug symbols - the problem is even when doing this certain operations just don’t show up in the profiler for some reason.

Maybe they’re getting inlined?

1 Like

You really need to measure the time on your own. You can use JUCE’s ScopedTimeMeasurement or PerformanceCounter to help you with this.

3 Likes

Reopening this because I ran into perceived trouble with LookupTable performance and did a little digging, hopefully it can help others:

I used PerformanceCounter to measure a process block running a chain of 2 juce::dsp::Oscillator oscillators @ 44.1khz on my 2017 iMac.

Release build dsp::LookupTable:

Performance count for “RELEASE juce osc lookup table” over 1000 run(s)
Average = 10 microsecs, minimum = 9 microsecs, maximum = 36 microsecs, total = 9711 microsecs

Release build sin(x):

Performance count for “RELEASE juce osc sin(x)” over 1000 run(s)
Average = 14 microsecs, minimum = 11 microsecs, maximum = 39 microsecs, total = 14 millisecs

Release build dsp::FastMathApproximations::sin:

Performance count for "RELEASE fast math approx sin" over 1000 run(s)
Average = 9 microsecs, minimum = 9 microsecs, maximum = 42 microsecs, total = 9374 microsecs

My takeaway is that when you want a simple sine wave or some other simple calculation, lookup tables don’t add much value. In that case the dsp::FastMathApproximations::sin would be the fastest. Lookup tables do make sense when your oscillators are built by more complex calculations, as the performance profile will remain flat.

I’m attempting to run a lot oscillators in my current project and somewhere around 12 voices x 8 osc per voice (yikes!) I run into > 100% CPU brickwall in debug. However, in release, CPU is only about 30%, so I thought I’d dig deeper into the debug builds.

Debug build dsp::LookupTable:

Performance count for “DEBUG juce osc lookup table” over 1000 run(s)
Average = 246 microsecs, minimum = 229 microsecs, maximum = 3741 microsecs, total = 246 millisecs

Debug build sin(x):

Performance count for “DEBUG juce osc sin(x)" over 1000 run(s)
Average = 76 microsecs, minimum = 1 microsecs, maximum = 138 microsecs, total = 76 millisecs

Debug build dsp::FastMathApproximations::sin:

Performance count for "DEBUG juce osc fast math" over 1000 run(s)
Average = 80 microsecs, minimum = 74 microsecs, maximum = 3004 microsecs, total = 80 millisecs

The lookup table apparently performs ~25x worse in debug, which is extreme. std::sin is ~5x worse and fast math is ~9x worse than their release versions.

I’m a C++ beginner, so I’m not sure if this is a normal difference of optimization in debug build or if the debug performance can be shored up at all. I’m currently leaning towards writing my own lookup table oscillator, as I need a couple extra features, it will be interesting to see how that measures up…

2 Likes