I’m working on a plugin with visuals that I repaint frequently (currently with 20fps), and on macOS it’s eating a lot of CPU (~25% on both M1 Macbook Air and a 2015 Macbook Pro). On Windows (a rather old i7) it takes less than 5%.
I’ve profiled and optimized around a bit and it doesn’t seem like my drawing code is exceptionally slow. The CPU time is burned outside my code and the JUCE layer, in the Profiler I see mostly CoreGraphics and other system libraries in the hottest paths… Even when I disable all my drawing code and just issue the repaint() frequently on only one component, which ends up drawing nothing, I get this high base load. And no, it’s not coming from the DSP part. When I remove the repaint() from my timer callback, I get <5% load.
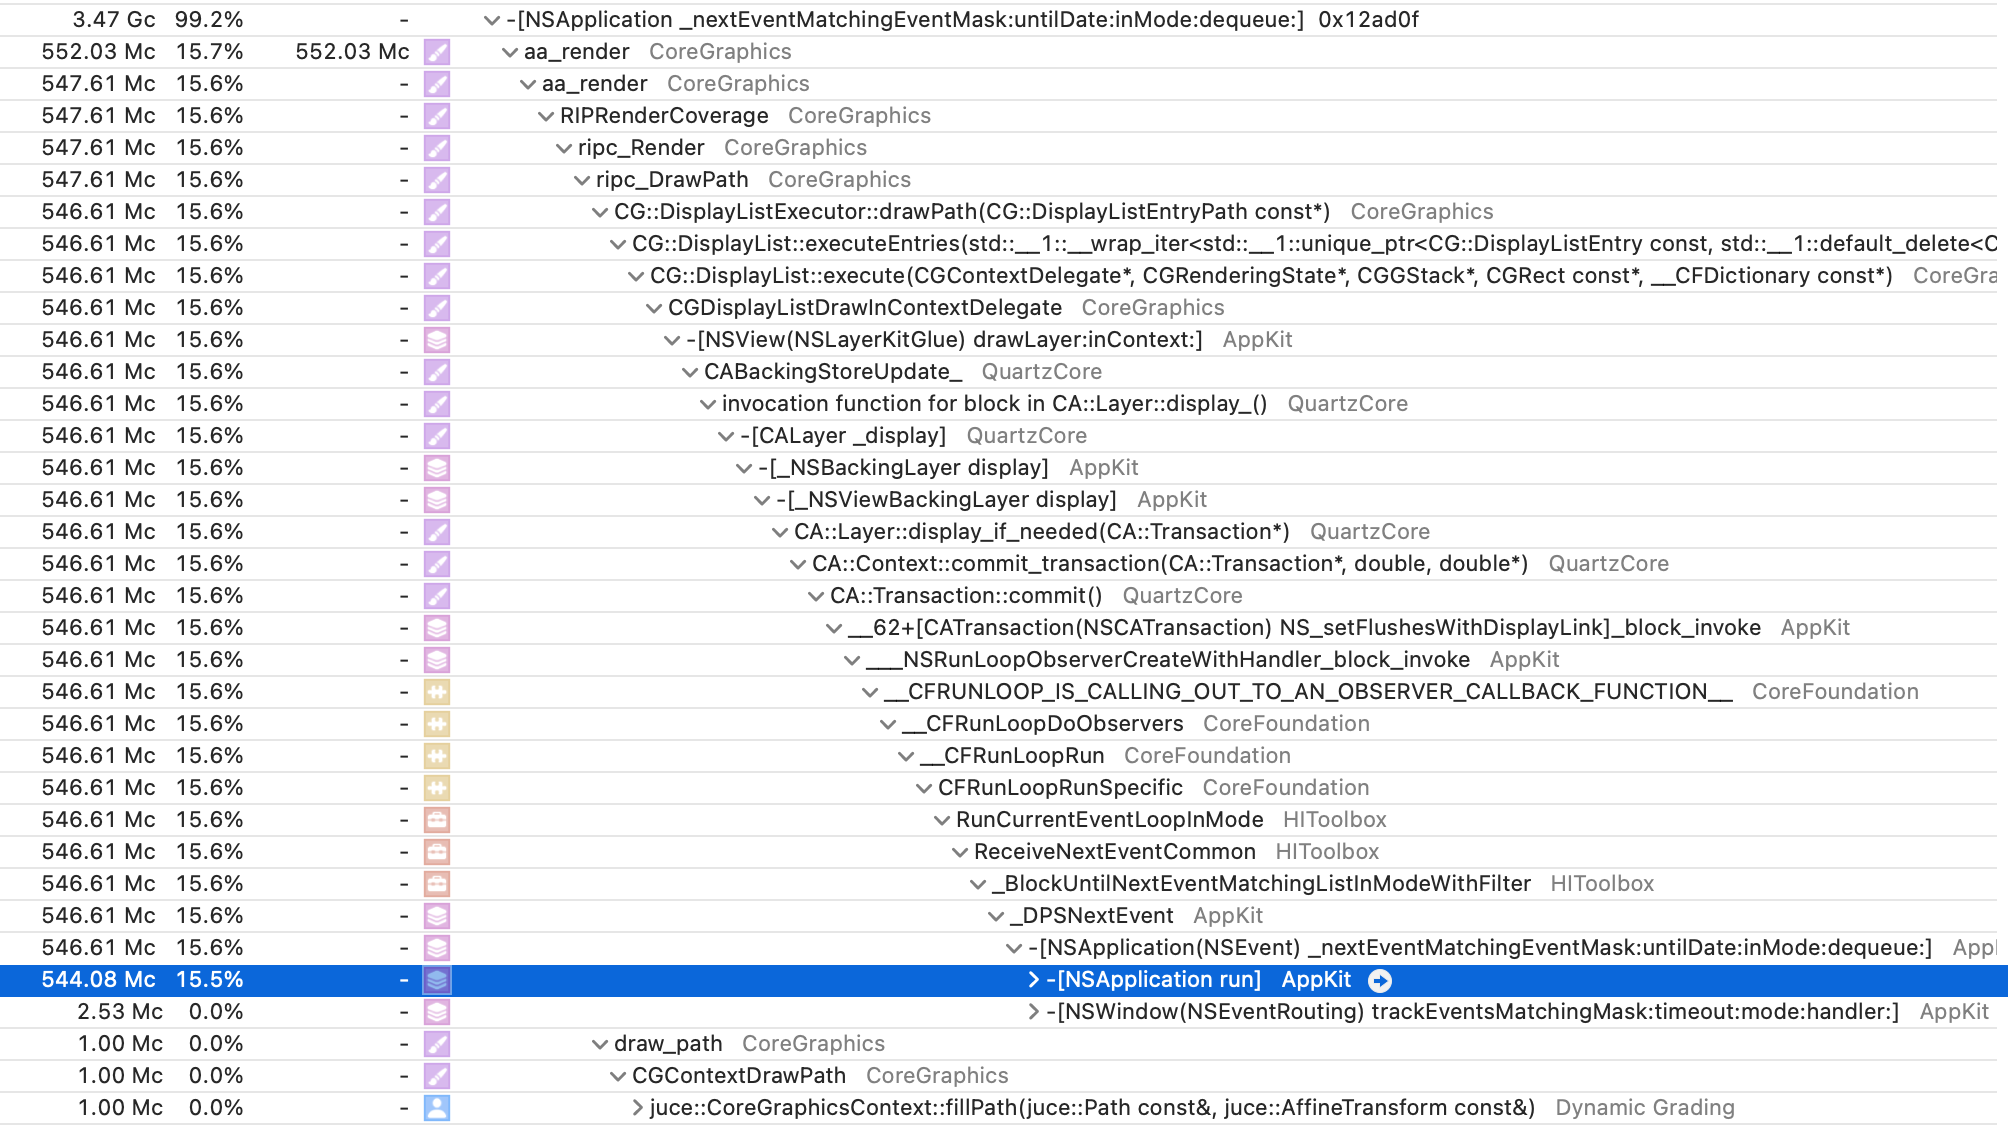
Here’s the top of my (inverted) call tree in Instruments CPU Profiler
I flaneured a bit through some drawing code which I mostly don’t understand and came across an obscure define called JUCE_COREGRAPHICS_DRAW_ASYNC. It’s nowhere defined and only referenced twice in juce_mac_NSViewComponentPeer.m.
I felt adventurous and enabled it. For some reason that helped and now I’m <10% for the Standalone app and according to profiler that’s nothing to do with drawing.
I’m kinda happy, but I hate not knowing what I’m doing. Any idea what I just did?
The JUCE_COREGRAPHICS_DRAW_ASYNC turns on asynchronous drawing for the underlying NSView. What happens is that the draw calls are offloaded to a background thread. The drawing is done using Metal on a different thread and thus freeing the message thread of that load. It’s a great feature to enable. I remember people experiencing some glitches in specific situations (search around on the forum) and this is why there is a way to actually turn on async drawing per component (probably componentpeer) using the setComponentAsyncLayerBackedViewDisabled method.
I had the opposite experience: enabling JUCE_COREGRAPHICS_DRAW_ASYNC does increase perceived smoothness/frame rate, but at the cost of much higher CPU usage.
I have a peak meter on the UI that I try to refresh at 60Hz.
JUCE 6.1.3
Reaper 6.5
4K display running at 200% scale
Mac mini 2018 i3
Here are a few figures I got (not DSP related, as CPU usage drops when the editor is not open):
Windows 10:
CPU usage around 1% in normal use, up to 7% when interacting with the UI very good perceived smoothness
MacOS with JUCE_COREGRAPHICS_DRAW_ASYNC=0 and a 10-bit color profile:
CPU usage around 30% in normal use, up to 90% when interacting with the UI bad perceived smoothness
MacOS with JUCE_COREGRAPHICS_DRAW_ASYNC=0 and a 8-bit color profile:
CPU usage around 20% in normal use, up to 40% when interacting with the UI good perceived smoothness
MacOS with JUCE_COREGRAPHICS_DRAW_ASYNC=1 and a 10-bit color profile:
CPU usage around 60% in normal use, up to 60% when interacting with the UI good perceived smoothness
MacOS with JUCE_COREGRAPHICS_DRAW_ASYNC=1 and a 8-bit color profile:
CPU usage around 60% in normal use, up to 60% when interacting with the UI good perceived smoothness
MacOS is painfully heavy on CPU compared to Windows10
Will JUCE 7 address this issue?
It’s possible that macOS is repainting more than required. Please see the discussion about the new rendering options in JUCE 7 and give JUCE_COREGRAPHICS_RENDER_WITH_MULTIPLE_PAINT_CALLS a go to see if it addresses the problem.