This might not be for everyone, but it’s been fun and helpful for me!
I’ve been working with AudioBlocks a lot and was missing an easy way to visualize blocks throughout development. I use Jim’s Buffer Debugger regularly, but that’s not an option running headless code like unit tests or for on-the-fly debugging.
Most of the time I just want a quick sanity check. Is the buffer empty? Is there some strange value in there? I want to see what AudioBlocks look like without playing guessing games with DBG statements.
I’m a huge fan of Tufte’s sparklines which are “small, intense, word-sized graphics with typographic resolution,” so I wrote a little helper to uhhh…show a normalized, time-compressed 3-bit waveform
Here’s a sine:
Block is 1 channel, 441 samples, min -0.999994, max 0.999994, 100% filled
[0—⎻⎺‾⎺⎻—x—⎼⎽_⎽⎼—]
Or a square:
Block is 1 channel, 441 samples, min -0.999994, max 0.999994, 100% filled
[0⎺‾⎺x⎽_⎽]
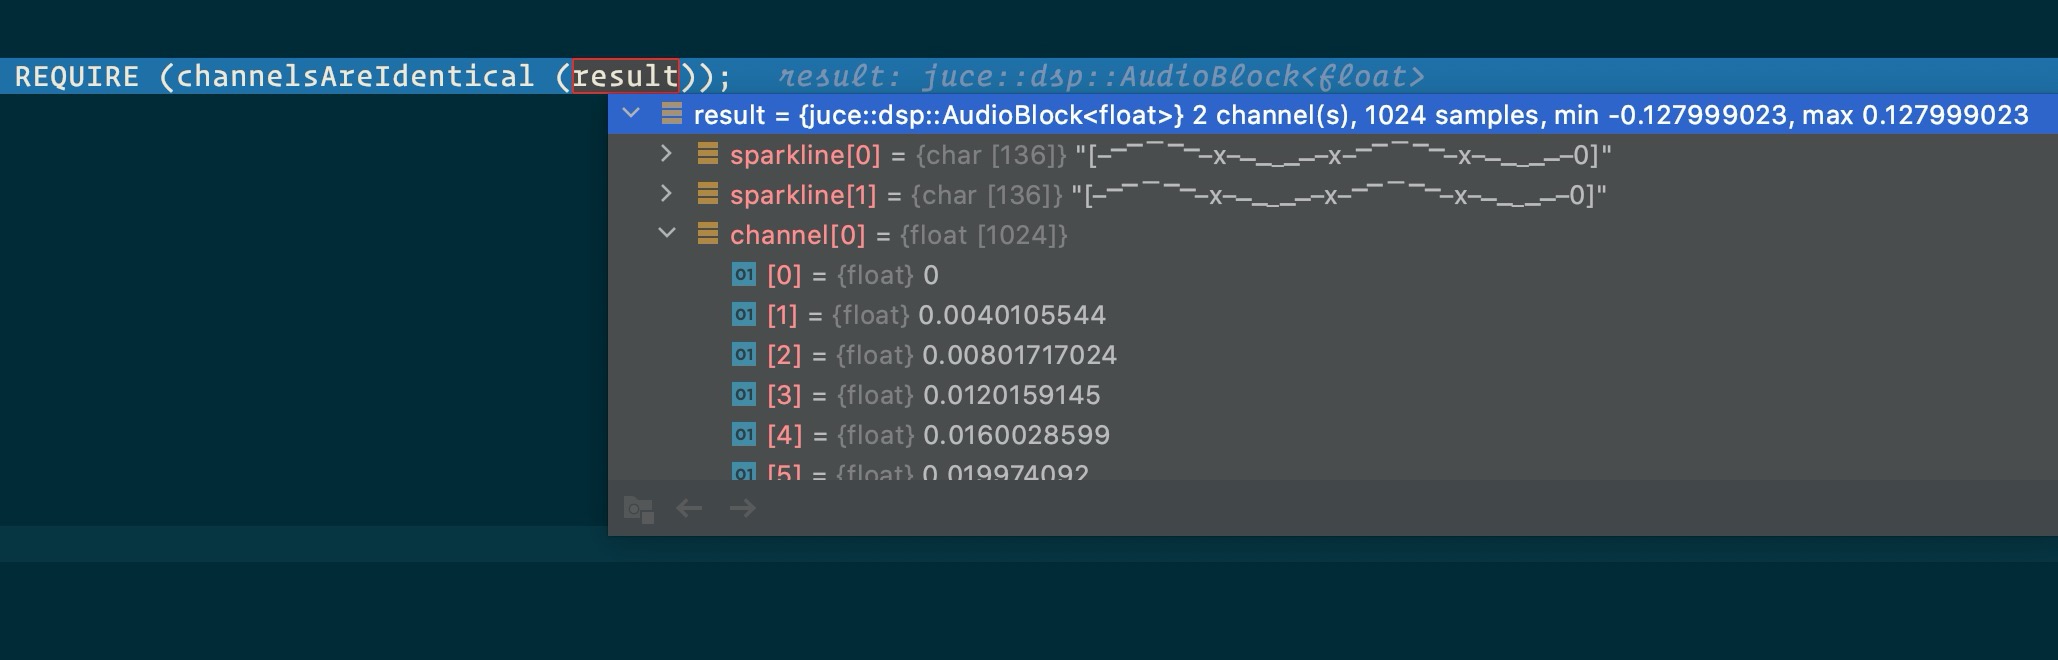
Inspired by @jimc’s really helpful lldb python script, I also taught lldb how to render sparklines on the fly for MacOS CLion/Xcode.
I added a few more features to the sparklines, such as display of NaN/inf/subnormal. It still only supports JUCE’s AudioBlock, but if there is interest in AudioBuffer, I could add support there too.
Nice! It should be pretty easy to bake in AudioBuffer support.
I guess you saw this one before right?
I saw that pop up! Cool stuff. I only use sparklines for visual sanity checking, for example, dumping the contents of a buffer on test failure, or inspection in the IDE…they are so decimated I wouldn’t use them as the subject of tests.
The diff idea here is cool! Pretty interesting idea to base tests on a medium-res visual representation, probably allows for some amount of wiggle room too (a good thing, since float values can be have a bit of variance).