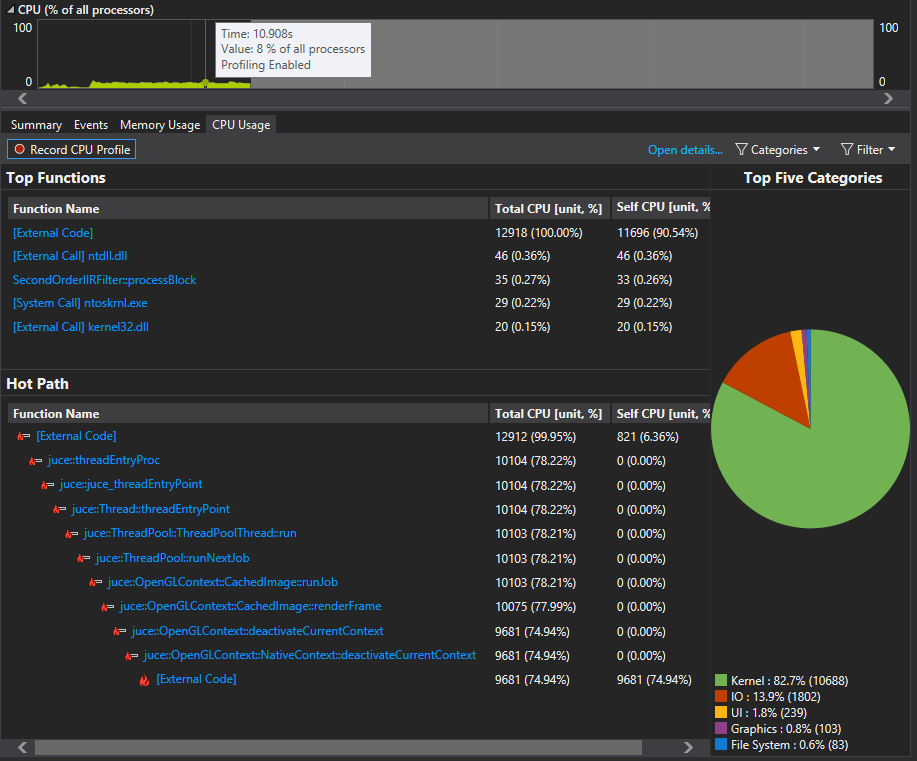
It is consistent across both build configs. Seems to be related to wglMakeCurrent() being called every frame, even though component rendering is off. (correct me if I’m wrong but it looks like this is needed to help synch the renderOpenGL() stuff and the juce paint() stuff?).
@reuk do you have any insight into this? Just clarifying that using openGL on windows in its current state, even without component rendering enabled, creates more cpu overhead than without it, by making seemingly unnecessary calls to wglMakeCurrent(). Do you consider this a problem?
Don’t even bother trying. It’s not a JUCE bug but rather totally normal behavior of WGL.
Also wglMakeCurrent(nullptr, nullptr) is necessary to guarantee functionality and to free the GL context for other processes. Read this:
This is also not a JUCE specific behavior. Last time I checked it was doing exactly the same in a raw win32 application and other media layer APIs like SDL. Although I think SDL throws in some sleep(frame_delta) stuff to mitigate it a bit. But this is not advised, since it will be worse for multi threaded processes like audio plugins.
In short: wglMakeCurrent is an inherently very heavy operation on Windows. The API call is not suited at all for multi threaded processes. The Vulkan API is much better in that regard, since it was designed for this kind of context/swapchain image acquisition.
Thanks for the explanation. Is this still necessary if the OpenGL thread is self contained and not rendering any juce components? I’m just confused by your answer as there are other plugins (non-juce) out there that use OpenGL and don’t seem to have this same overhead. Fab filter is one example. This implies to me that this isn’t the inevitable outcome you claim it to be.
“This is fairly system-dependent, but 0 turns off syncing, 1 makes it swap on frame-boundaries.”
Which essentially means: Most NVidia cards ignore this, because they prioritize the system panel settings.
Then: Try to test it with a more realistic case instead of an empty renderer that runs in a tight loop.
This may seem counterintuitive but think about it this way:
If you do nothing in your render code, no time is spent between the next wglMakeCurrentCall. Which means: The less you render, the more often the frame is restarted increasing the context acquisition. For testing purposes you could throw in a Thread::sleep(ms) and wait a few milliseconds until the next frame. This may clear up the relation of “CPU time spent” and actual processing time used by the wglMakeCurrent.