I’ve got the following code being used inside a lambda, that is being used with that new ThreadPool::addJob(std::function<>) that was added to the latest tip a couple days ago.
void AuthenticationInterface::initializeServerConnectionThread(ServerString& postData) {
    auto ai = this;
    juce::String post = postData.value();
    auto a = [ai, post]()
    {
        int statusCode = 0;
        juce::URL serverRequestURL = juce::URL(ServerConnection::GetChordieURL()).withPOSTData(post);
        juce::ScopedPointer<juce::InputStream> stream(serverRequestURL.createInputStream(true,
                                                                                         nullptr,
                                                                                         nullptr,
                                                                                         juce::String(),
                                                                                         20000,
                                                                                         //-1, //infinite timeout
                                                                                         nullptr,
                                                                                         &statusCode )
                                                      );
        juce::String reply = "FailedToConnect";
        bool result = false;
        if( stream != nullptr ) {
            reply = stream->readEntireStreamAsString();
            result = true;
        }
        ai->receiverCallback( reply );
        return result;
    };
    MatkatMusic::OneShotThreadPoolQueue::AddToQueue(a);
}
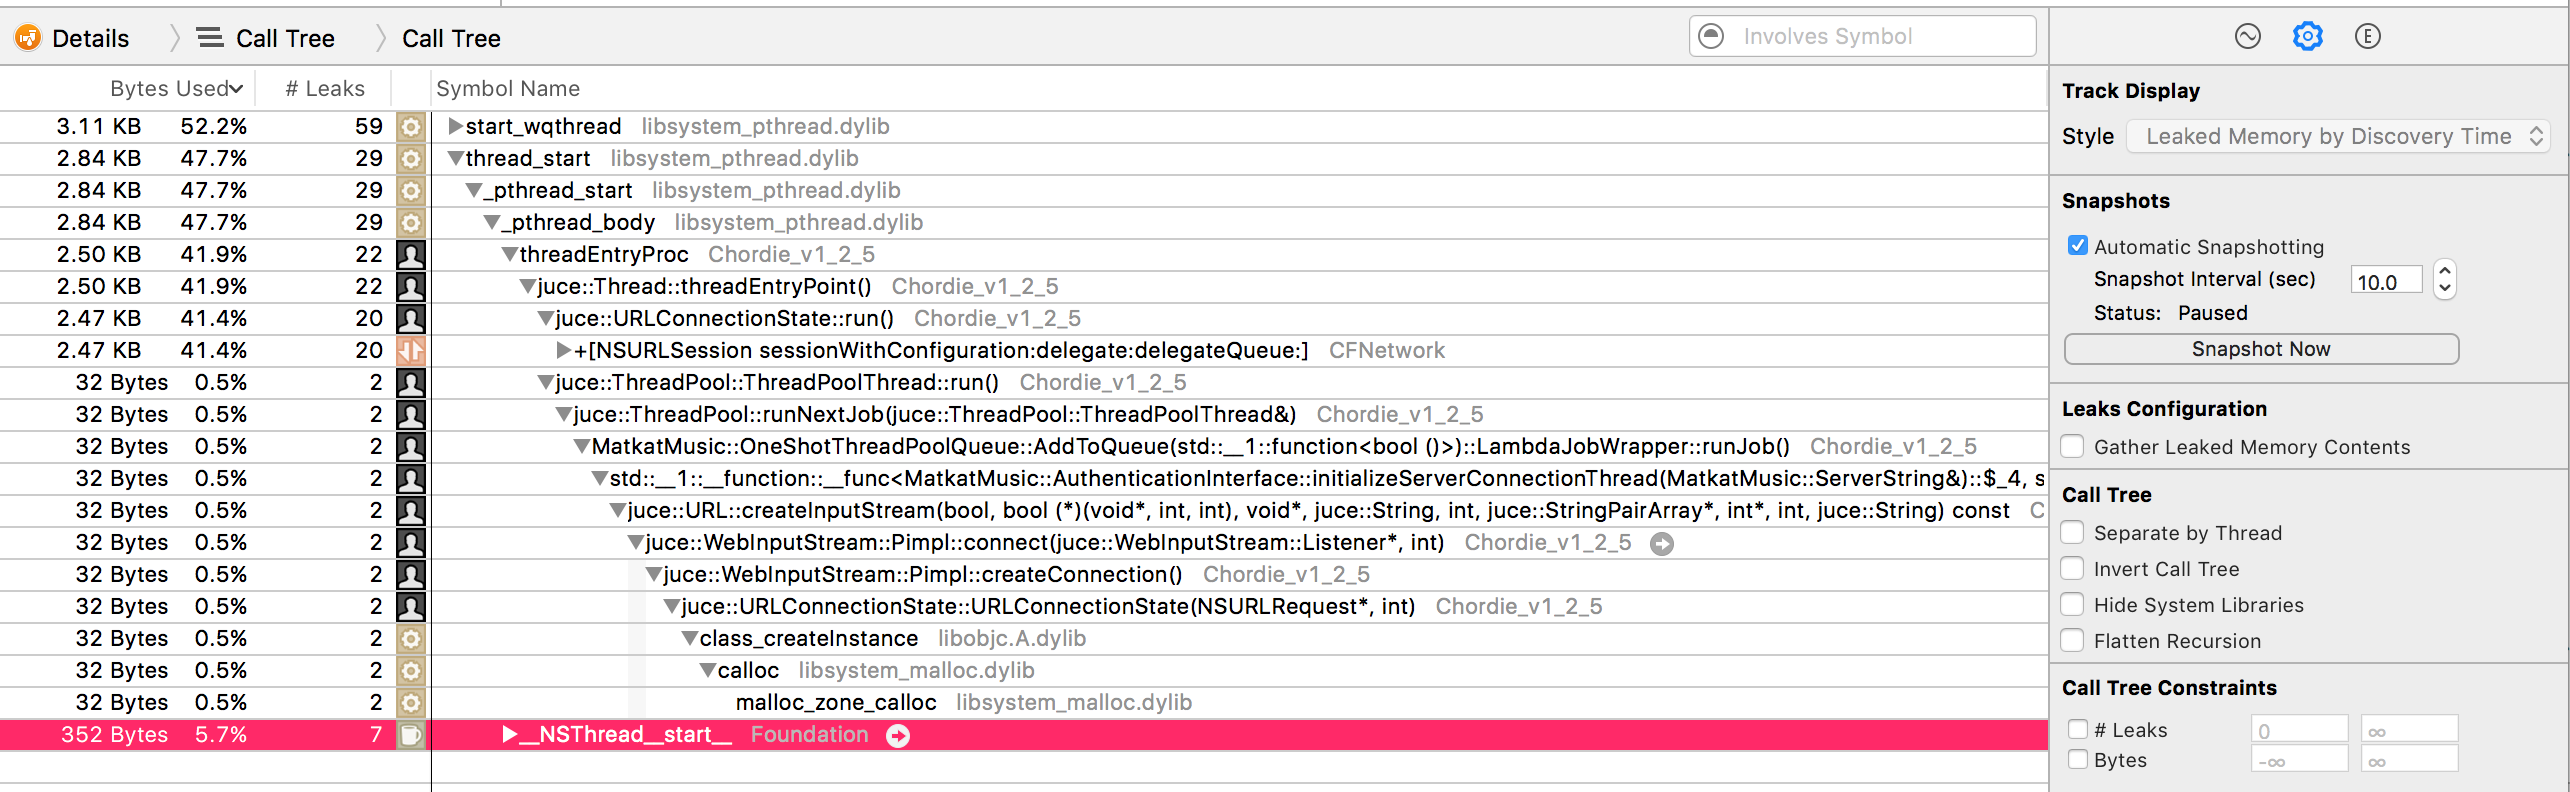
I can’t seem to figure out why i’m getting a leak, other than that the ScopedPointer in the lambda never gets released. But i’m just guessing when I say that. When I profile, this is what I see:
Are you sure it’s just the InputStream that’s leaking? Can you press continue a few times and see if there’s any other objects which may also be leaking?
One immediate thing that does jump out is the round-about way of capturing the this pointer. Unless you’re absolutely certain this object will live for the duration of your whole app this is likely to be problematic.
As a general rule, you should never capture this pointers unless this owns the thing that’s doing the capturing (this this is out of the question for async or threaded code).
I’m not getting leak messages tho. I just noticed that the memory usage kept increasing as the app ran, and the Profiler reflects the memory leak accordingly…
ok, here’s the test code for you juce devs. @dave96@jules@fabian@ed95 no leak messages, but the memory usage keeps increasing. This should be a fun bug to solve!
Make a generic GUI project, and put this in MainComponent.h:
just wanted to add that @Xenakios helped me out in the IRC channel for JUCE and this appears to be specific to OS X. Windows doesn’t have the same problem. I let it run for about 20 minutes and the memory usage climbed from 15mb to 115mb. It’s possible that it’s not a leak, just the heap for the app growing, perhaps. but that is way beyond my expertise and ability to figure out why.