hello all. according to the tutorial it mentions there is a debugger and it gives a brief explanation as to where it is but i’m assuming it’s for the mac version as it makes no sense to me. How do i access the Juce debugger in Windows please so i can test my plugins?
The tutorials don’t say that JUCE comes with a debugger, which it doesn’t and won’t (because that’s the job of the tools, of which are paired up with Visual Studio in this case). Instead, the tutorial only talks about how you can debug your plugin, and the steps to do so with the AudioPluginHost (which is a project in the JUCE repository).
take a look at that page i posted the link to. it says clearly that it has a debugger.
" Set up plug-in debugging (optional)
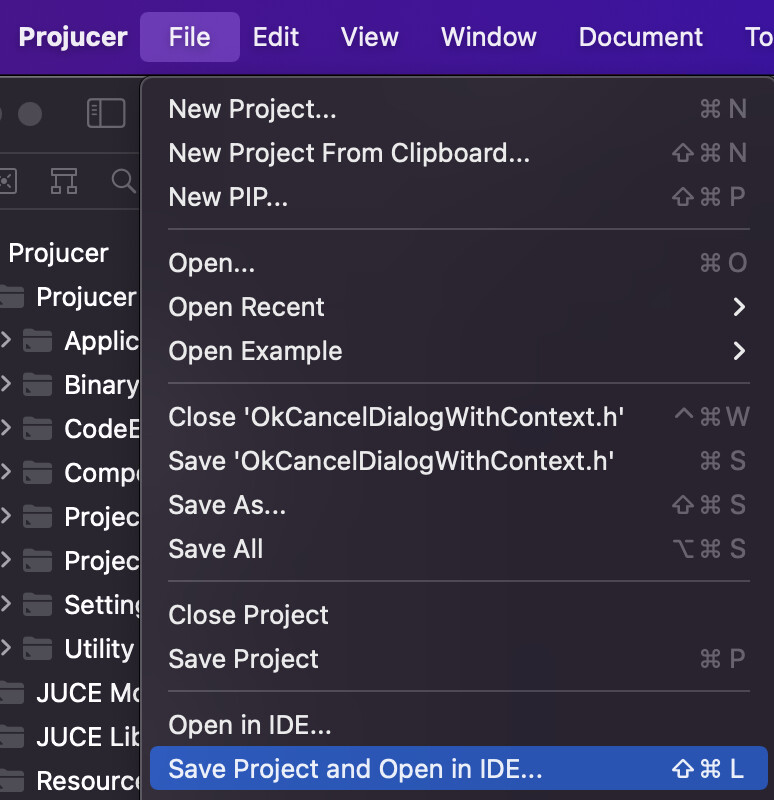
One of the challenges of building plug-ins is testing them. Thankfully, JUCE makes that easy, with a built-in plug-in host. To access the host go to extras/AudioPluginHost/ and open the .jucer file with the Projucer. Click Save Project and Open in IDE…. Then inside your IDE build the project to create a binary (which on Mac OS X you will find at extras/AudioPluginHost/Builds/MacOSX/build).
Run the application and you will see the graphical node editor that looks like this:
"
probably because it says " Set up plug-in debugging".
but as you say, beside the point. I’ve found it and built it. it should make things simple for testing any plugin i build
Since there’s a difference between “testing” and “debugging” and I don’t think it was specifically detailed in earlier replies, it is worth noting that the Set Up Plug-In Debugging section of the tutorial does in fact provide guidance on how to fire up your IDE’s debugger (trimmed to refer only to Visual Studio, as implied by the original question):
Used in this way the Plug-In Host gives you a very simple environment in which to test a plug-in, but there’s more that we can do. We can configure the host to enable step-through debugging of your plugin…In Visual Studio on Windows you should go to the properties page of the VST3 build target, select the “Debugging” pane, then set the path to the AudioPluginHost executable in the “Command” field.
This causes the AudioPluginHost to be invoked when you debug the plug-in. Your plug-in can then be loaded and run within that host. You will then be able to set break-points in your plug-in code and do all the usual things you would expect of a debugger within Visual Studio.
If you are using tools other than Visual Studio you will need to identify the analogous steps within that toolset to setup such a configuration, but the general thrust remains the same.
it certainly does. my concern was the location of the testing facility but found it in the extras folder under the juce base path. it sure makes testing a lot easier.
FTR: you can debug your plugin in most hosts, unless they added counter measures to make reverse engineering and cracks difficult or macOS, which also makes things difficult sometimes with notarisation and crap.
There is nothing special in AudioPluginHost, except that it is as simple as possible and you have the source code, which is a huge plus.