I would like to include a graphic display for some of my plug-ins. For example, a frequency response plot to go with my multi-band equalizer or a real-time spectrogram of the audio stream. Any suggestions?
I’d suggest looking at juce demo or online github JUCE based projects.
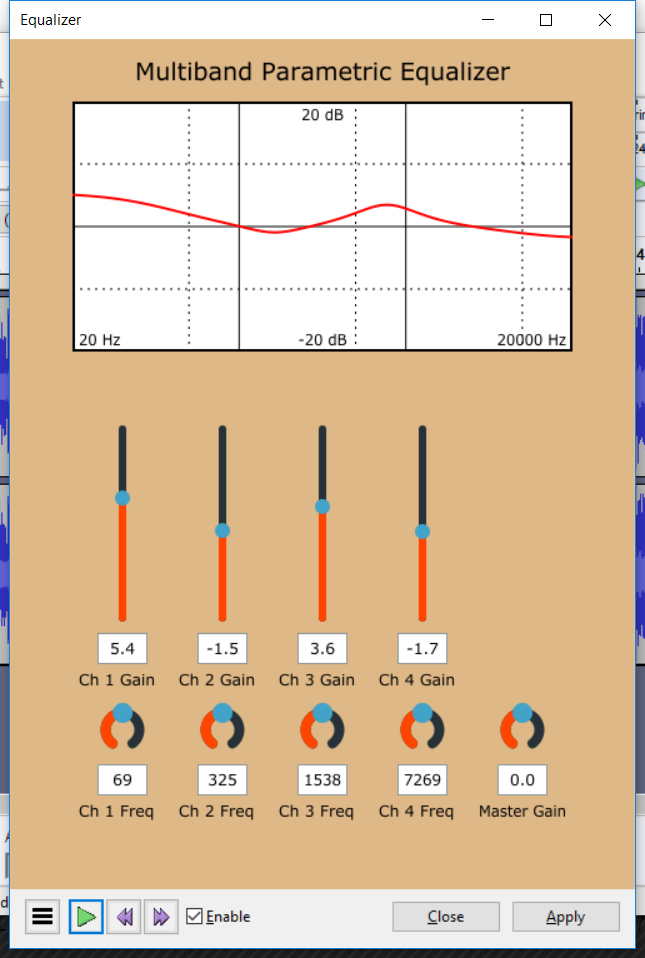
I now have a rough version of an multi-band equalizer with a graphic display of the frequency response. Created a custom component. Kind of crude at the moment - no axis data, just a curve. Driven by timer callback rather than directly by slider changes. Derives FR data from EQ filter object, so only responds to changes when processor is running. Fun!