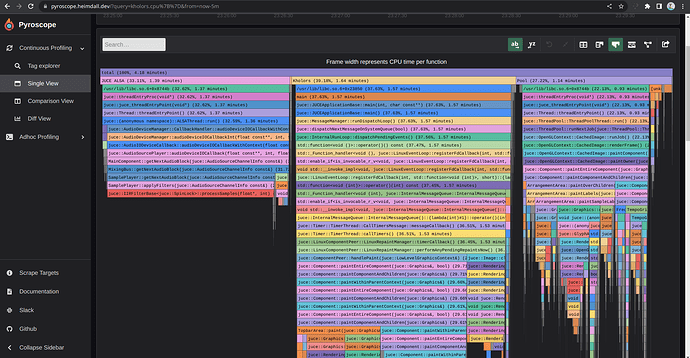
I recently discovered we can use eBPF profiling (Linux kernel feature) to send frame stack data to pyroscope. It work with any binary for which there are debugging symbols. I gave it a try, and it was the most amazing C++ performance profiling I’ve ever had. See how it looks:
More specifically, you can see cpu usage in the different threads, use your app, and see how the flame graph change depending on what you do!
More documentation here. Downside is that it’s Linux only though.

