How to debug (attach to) auval - need help - latest procedures?

I need to debug into auval to find out why my plugin is crashing Logic.

I found several (older) threads here and have attempted to follow instructions. Rather than wake up the old threads, I’ve started a new one.

Running Mojave 10.14.5.

I have copied auvaltool to /usr/local/bin.
I have specified this as the Debug Executable in the Scheme:

At this point, if I run my plugin attached to this, it launches auval and immediately returns. No errors, just nothing happems

In one discussion I saw mention of passing arguments to auval. I am assuming this means in the “Arguments” tab of the Scheme settings?

pass the following four arguments -t TYPE MANU SUBT

So I tried like this:

I run it, it says “running auvaltool” briefly and then immediately returns. I set breakpoints, nothing happens.

I also tried the args like this, separately. Same results:

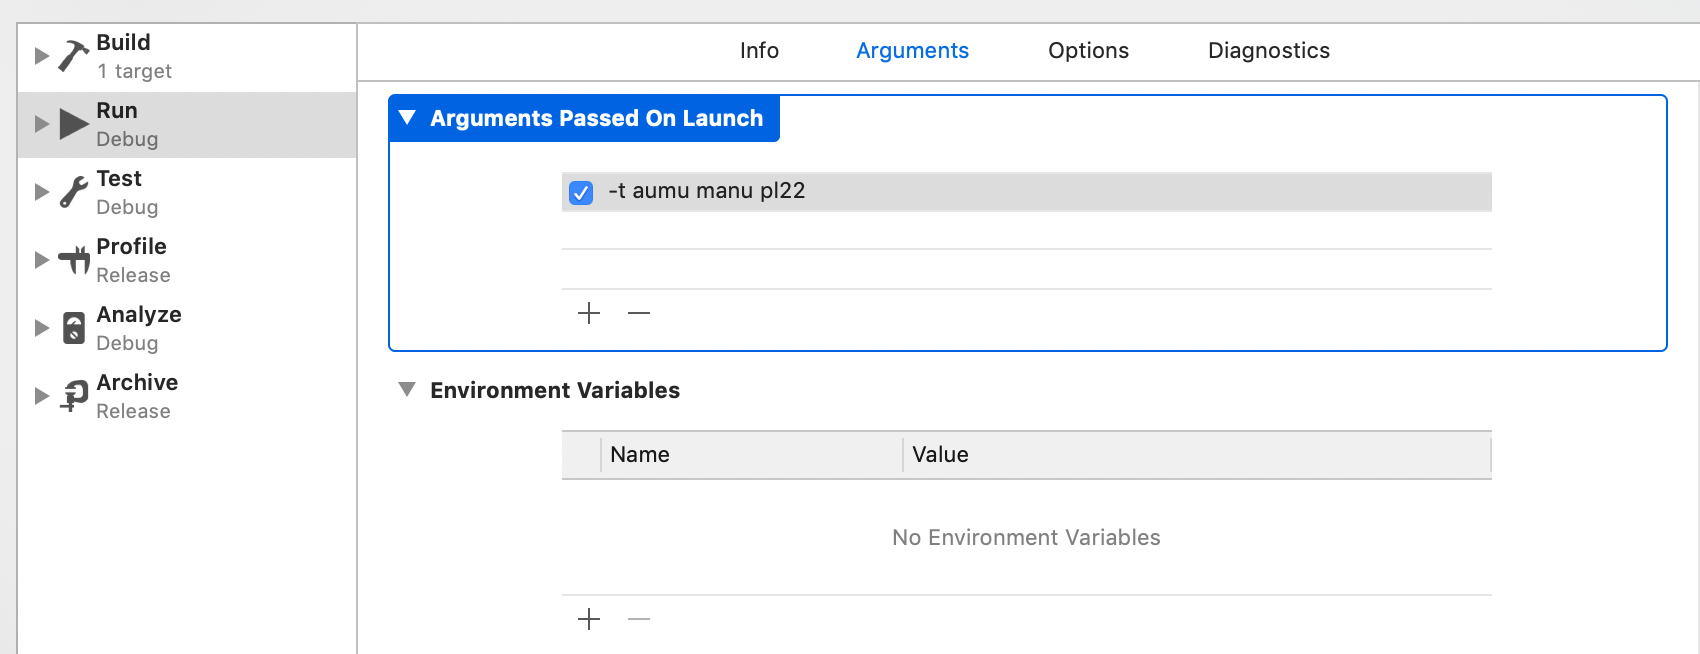
I’m not getting any warnings about system integrity or anything; just it immediately exits and nothing happens. If I run ‘auval -t aumu manu pl22’ from Terminal it works, so I know these are the correct values.

I think I must be doing this wrong but I can’t find any examples of how to set this up properly. Thanks!

Can you try replacing the -t for a -v? That was changed a while ago.

IIRC the aumu and manu are swapped when using -t instead of -v.

EDIT: Sorry, just see now that the values worked in the terminal, so that’s probably not a solution…

I tried -v, with the args reversed. That works in Terminal too. But no change in debugging from Xcode.

By the way, what is the correct way of passing the args? All on one line like my first example, or as four separate variables like my second example?

Also, I just notice in the Xcode Reports Navigator, it shows for Debug:
Message from debugger: Error 1
Program ended with exit code: -1

EDIT: I just found that this may indeed be related to System Integrity or hardened runtime:

https://developer.apple.com/forums/thread/119059

Just wanted to post this before I try the steps which require shutting down my system, rebooting from Recovery partition, etc.

Have you tried running pluginval on it? That might give you some extra diagnostic info.

I did. Strangely, it passes everything and shows no crashes or asserts. Whereas auval run from Terminal shows:

Checking ramped parameter scheduling
  PASS

Test MIDI
  PASS

* * PASS
--------------------------------------------------
JUCE Assertion failure in GlobalData.h:202
auvaltool(86265,0x119c035c0) malloc: *** error for object 0x7f7f48230000: pointer being freed was not allocated
auvaltool(86265,0x119c035c0) malloc: *** set a breakpoint in malloc_error_break to debug
/usr/local/bin/auval: line 8: 86265 Abort trap: 6           arch -x86_64 /usr/bin/auvaltool "$@"

Putting them individually is safer, in case Xcode would quote an argument. But afaik it doesn’t make a difference.

Just to doublecheck, did you copy auvaltool to a path that the OS doesn’t care about? Try copying it into your home folder.

Those tools are unfortunately sometimes poking in the mud.

It turns out it was a System Integrity/hardened run time issue. After booting into the Recovery partion and disabling SIP according to the following link, I can now debug into auval.

https://developer.apple.com/library/archive/documentation/Security/Conceptual/System_Integrity_Protection_Guide/ConfiguringSystemIntegrityProtection/ConfiguringSystemIntegrityProtection.html

This is probably something you’re already aware of, but double checking – are you testing the VST of your plugin in pluginval and the AU in auval? If so, they won’t necessarily fail in the same ways at all.

Thanks. No, I’m testing the AU in both auval and pluginval. I made another post about that:

1 Like

I’m pretty sure that resigning auvaltool will solve this issue so that you can leave SIP enabled, there are a bunch of posts about how to do this already on the forum.

2 Likes

I have the same problem (malloc_error_break) and would like to debug it with XCode and auvaltool but it’s just not working.

I mean I’ve done all those steps and XCode starts the auval and outputs the stuff in the console, but breakpoints don’t work. It just outputs the same content in XCode that I already see when I’m using auval in the terminal. What I’m interested in is breakpoints. I’ve tried it now for 3h and nothing works. Googled and used a lot of content from this forum…

Any hints?

I’ve copied the “auvaltool” to my home folder documents, I’ve code-signed it and I even disabled SIP.

In the terminal I use the command auval -v aumu XXXX YYYY and it “works” (I get output, sometimes it passes, sometimes the error appears). In XCode for the Debug AU configuration I’ve selected Executable: “auvaltool” (this file I’ve copied and code-signed in my documents folder…). The checkbox “Debug executable” is disabled because otherwise I get an error. As arguments I’ve -v aumu XXXX YYYY

What happens? Well it launches auval and I see the same output like in the terminal now in XCode … but breakpoints don’t work. If I launch the plugin as standalone, then all the breakpoints work.

Edit: Sorry, it seems to work! The checkbox was wrong and I fixed that error meanwhile… gladly… I got depression haha :smiley:

Thanks, resigning auval worked!
Here is the post how to re-sign, in case anyone should stumble upon this topic:

See the post by danielrudrich in that thread, which contains the re-signing script.

2 Likes